LinkedIn Ads Lift Analysis
Lift Analysis compares deals where the company engaged with your ads against deals where they didn't.
How LinkedIn Ads Lift Analysis works
Lift Analysis pulls your deals from your CRM and splits them into two groups:
- LinkedIn Influenced deals where the company had LinkedIn Ad touchpoints that met your configured influence threshold
- Other deals where the company did not meet the influence threshold
It then compares the two groups across key metrics and calculates the percentage lift for each one. You can run analyses over a 6-month or 12-month window.
Analysis types
There are two types of lift analysis you can run:
Closed Won Lift (recommended)
Compares closed-won deals and measures:
- Close Rate Lift the difference in close rate between deals your ads touched and deals they didn't
- Average Deal Size Lift the difference in deal value (ACV) between the two groups
- Sales Cycle Lift the difference in sales cycle length between the two groups
Pipeline Lift
Compares all deals in the pipeline and measures:
- Average Deal Size Lift the difference in deal value across all pipeline stages
Similar-sized deals
By default, Lift Analysis compares all deals regardless of size. But deal size can skew results. If LinkedIn Influenced deals happen to include more large deals, it's hard to tell whether the higher close rate is because of LinkedIn or because of deal size.
The Similar-sized deals mode solves this by grouping your deals into size bands based on deal amount. Metrics are compared within each band, then combined into a weighted average. This way, a $10K deal is only compared against other $10K-range deals, not against $500K enterprise contracts.
When using Similar-sized deals, the results page shows tabs for each deal size band so you can see the metrics for each band individually, or view the weighted aggregate across all bands.
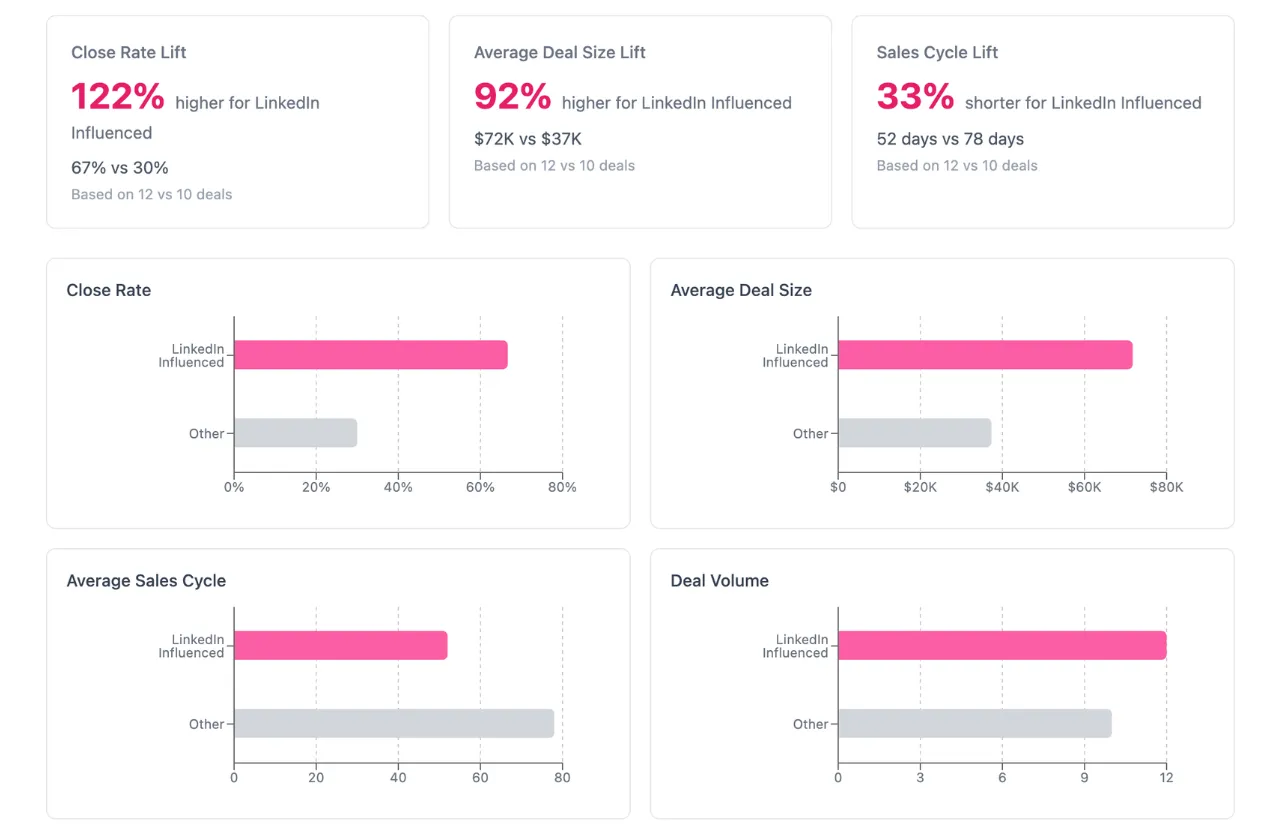
Reading the results
Once an analysis completes, the results page shows:
- An executive summary that describes the key findings in plain English, which you can copy to clipboard
- Lift percentages for each metric, with the number of deals behind each comparison
- Side-by-side bar charts comparing LinkedIn Influenced vs Other deals
- Deal size band tabs when using Similar-sized mode, so you can drill into each band
You can click on any bar chart to drill down into the underlying deals, where you can sort and filter by deal name, amount, stage, and date.
Small sample warnings
If either group has fewer than 30 deals in a segment, the results page shows a warning. With small samples, a single deal closing or not can swing the lift percentage significantly, so the numbers become less reliable. The warning tells you which group is small and how many deals it contains.
The individual metric cards also flag when they're based on a small sample. You can still see the data, but treat it as directional rather than definitive.
Influence threshold
A deal is considered "LinkedIn Influenced" if the company behind it has LinkedIn Ad touchpoints that meet your configured influence threshold. By default, this means at least 7 paid impressions or at least 3 organic impressions.
You can adjust the influence threshold in your attribution model settings. The same threshold is used across Company Insights, Campaign Analytics, and Lift Analysis for consistency.
Exporting results
You can export any analysis as an image using the export button at the top of the results page. This is useful for sharing results in presentations or Slack. The executive summary can also be copied to clipboard directly.
Requirements
To use Lift Analysis, you need:
- A connected LinkedIn Ads data source
- A connected CRM (HubSpot, Salesforce, Attio, or Pipedrive)
- Deals in your CRM within the selected time window