Practical Guide to Tracking LinkedIn Ad Influence in your CRM with Fibbler
Freddie Hammond, Sr. Director of RevOps @ Pinpoint
Quick Links
Introduction
Understanding the influence of your LinkedIn ads is a well established challenge. Prospect journeys are rarely linear, and the prevalence of non-conversion driving ads can make assessing the impact of your ad spend and creatives over time very difficult.
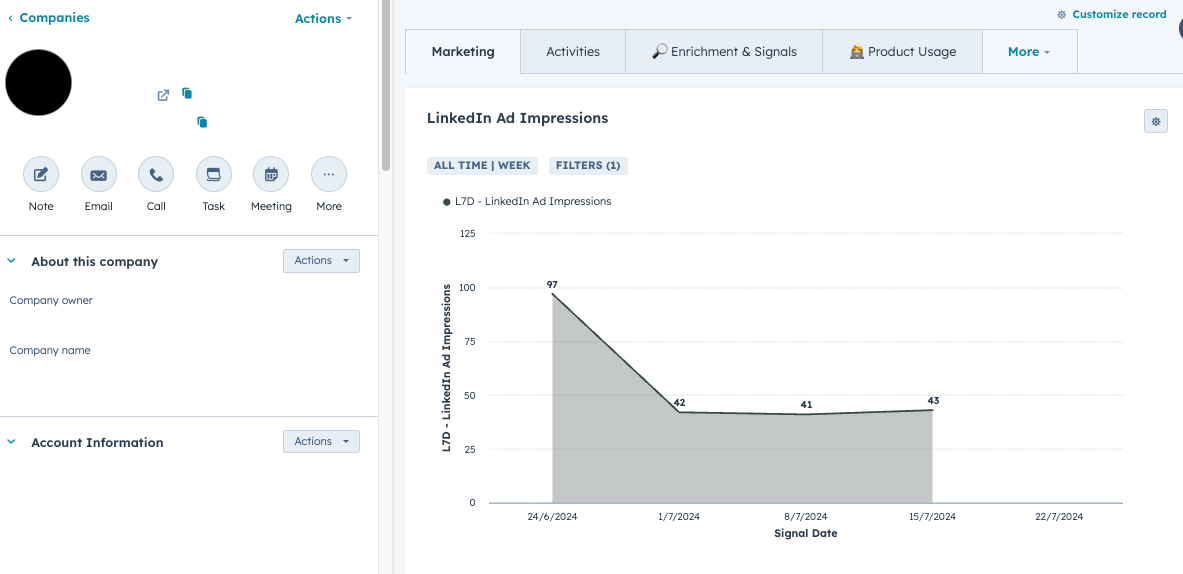
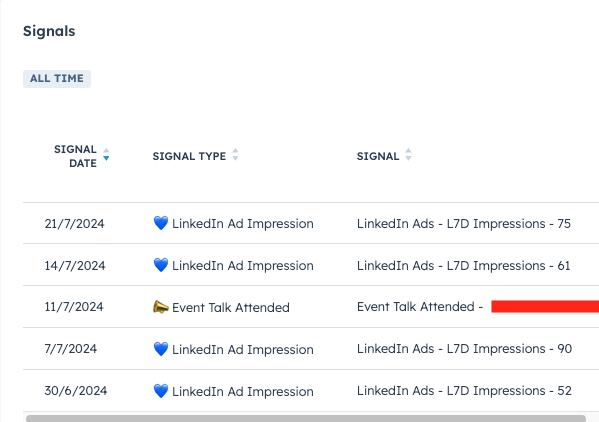
If you believe that company-level impression data like the example below can enhance your ABM efforts, then this guide is for you.
Some Context
At Pinpoint in late 2023, we launched a new approach to the way we think about our target audience and how we can measure our marketing influence.
Faced with declining success in outbound efforts and gearing up for a more targeted approach to our chosen segments, we knew we needed a more effective method of tracking and identifying opportunity among our target accounts.
Getting Started
Fibbler’s own in-app dashboard provides useful spend and influenced pipeline measures for any date range chosen, along with the ability to export company level data.
The real sauce, however, lies in the weekly CRM syncs for both HubSpot and Salesforce; these are the main subjects of this guide.
Steps
The steps I have laid out here are all HubSpot-led, but very similar can be replicated by Salesforce users. As a pre-step to all of this, I recommend checking out the notes section below for details on creating and maintaining a target account list in your CRM.
Step 1 - Fibbler CRM sync
Once you have connected your LinkedIn ad account and chosen CRM in the data sources tab , you’re ready to enable your data syncs.
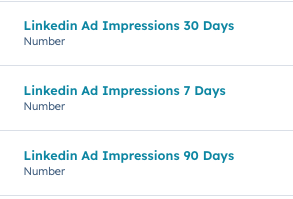
In the data sync tab , select to enable all three of the last 90, 30 and 7 day options.
Once enabled, you should have 9 new properties/fields in your company object. These will include clicks, engagements and impressions for each of the time period syncs.
Every 7 days, data from matched accounts will be synced into these properties.
Step 2 - Signals custom object
To set up your custom object, head to the objects dropdown in HubSpot settings and navigate to the Custom Objects page. Create a new object here, making sure to set a friendly object name and description.
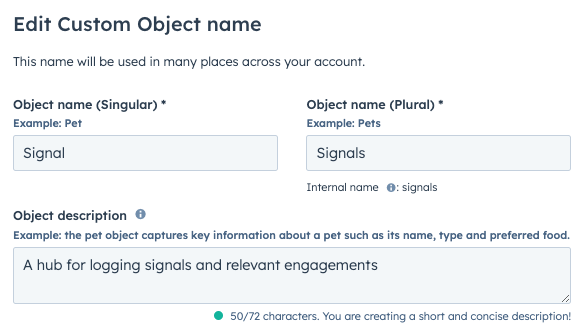
In this view, set up your primary display property as ‘Signal’, a single-line text property to act as a simple title for each record.
Properties to create:
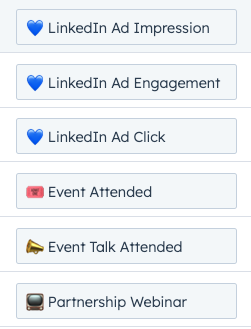
- Signal (single-line text): Your signal name to be easily interpreted across HubSpot (e.g., the name of an event)
- Signal Type (dropdown): The category of signal (e.g., LinkedIn ad impression)
- Signal Date (date): The date of the recorded signal. While the create date is always applied by default on any object in HubSpot, if you ever need to backdate some signals, it’s essential you have a field you can update.
- For LinkedIn signals, set up three new numeric properties: Last 7 Days - LinkedIn Ad Clicks, Last 7 Days - LinkedIn Ad Engagements, Last 7 Days - LinkedIn Ad Impressions
A little dropdown field tip to spice things up: Add relevant emojis to your type field. This makes the whole experience more visual in your CRM, particularly at the contact/company level.
Associations are key to the successful configuration of a new custom object. In this case, we need to set up associations with contacts and companies. In the case of LinkedIn ad signals, we will only use the companies association, but many of your other signals will be at the contact level.
- Contacts Association: Set 1-to-Many association and your association label to ‘Signals’
Once the above is complete, you’re ready to start configuring signal creation flows.
Step 3 - LinkedIn ad signal workflow
For your LinkedIn ad signals, the workflow is incredibly simple. This may not be the case for all signals you may wish to track, but the Fibbler sync makes this process easy.
As Fibbler’s sync pushes data to the company level only, the workflow has a company enrollment trigger. We’re going to use the 7 day sync fields for impressions, engagements and clicks to create three types of signal that refresh each 7 days with newly synced Fibbler data.
For all three, the logic is the same, with enrollment criteria being ‘LinkedIn Ad [Impressions/Clicks/Engagements] 7 Days’ is greater than 0. Re-enrollment should be switched on and the box ticked to re-enroll companies each time the field is updated to a value greater than 0.
Below you can see the simple logic for the signal creation. Here we set the signal name with the following structure; LinkedIn Ads - L7D - [Impressions/Clicks/Engagements] - [Count].
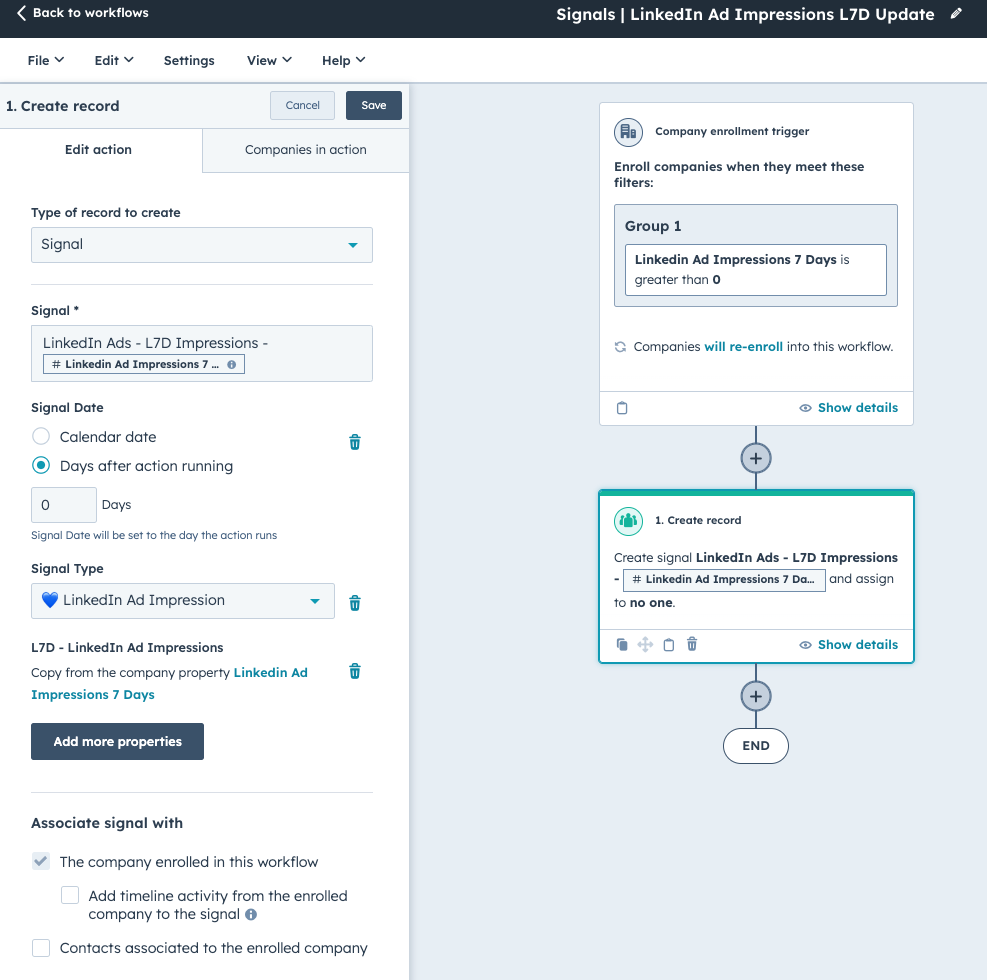
Using a similar naming convention for all of your signals makes things easy to digest when viewing at contact/company level.
- Set your signal date as 0 days after action running
- Your correct signal type
- Copy the corresponding LinkedIn impression/click/engagement count from the company record to your signal level versions of the fields
Once you have created your first workflow, clone it twice to then configure it for the remaining two engagement types.
You’re now ready to go. Every 7 days, if Fibbler records any impressions, clicks, and engagements from matched companies, each of your corresponding workflows will trigger to create a new signal against that company.
Step 4 - Setting up contact and company level views
Visualizing touchpoints and engagements at contact and company level has historically been painful in HubSpot and Salesforce. With Hubspot’s flexible new view creation, you can customize the way your CRM users interact with your data in all sorts of powerful ways.
On both contact and company level we have created an Enrichment & Signals tab, playing host to all of the core data points we are enriching for, along with a log of associated signals. This means reps are equipped with all of the relevant details on that contact/company’s current context and engagement level without navigating to multiple places.
I’d recommend trying out the data highlights, property list and report cards here. Report cards here work on single-object reports, perfect for presenting your signals data.
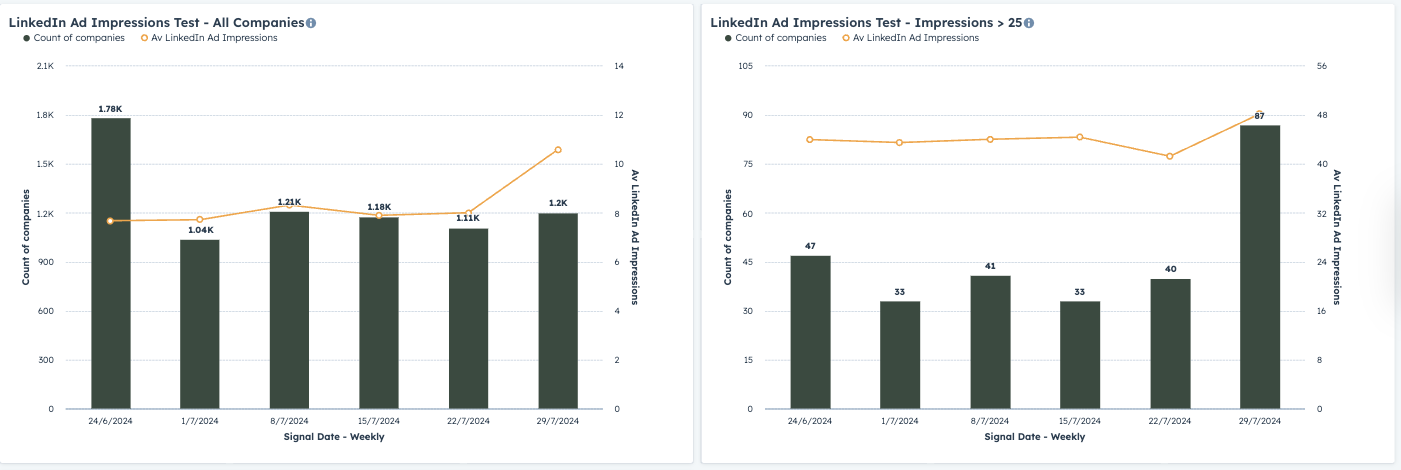
As a sample, the below shows one approach you could take to looking at LinkedIn ad impression data over time at company level.
Step 5 - Building scoring and notifications from signals and the Fibbler properties
To get real value from this signal-based approach, it is going to take time to build up the dataset with each weekly sync. Before that dataset is ready to go for reporting, there is still a lot of value in setting up some simpler reports, scoring, and notifications.
- Create your own LinkedIn engagement score field using Fibbler’s 90 day sync (or your new signal events). Take impressions and/or engagements, along with your company size information, to build a scoring model like that you will find in Fibbler’s application or in the LinkedIn company engagement report.
- Set up lead routing, a task and slack notifications via HubSpot workflows once certain target accounts reach a chosen threshold of linkedin engagement.
- Build a quick custom report based on Fibbler’s 90 day impressions property to get an early eye on the current scope of deal influence after your first sync.
- You’ll want Companies as your primary source, and deals as a secondary source. Set your filter to ad impressions greater than x (start with 0), and then number of open deals > 0 (or leave this to see all companies + deals). If you have renewal deals you’ll likely want to filter these out using a deal pipeline filter. You can then choose to view this by company in a table, or as counts, viewing the number of influenced records.
Step 6 - Signal-based reporting
Once you have a few weeks worth of syncs, you’ll be ready to take your reporting to the next level. As of early August 24, we’ve just started to test the waters with this reporting in HubSpot, but I have laid out a few of the useful reports we’re working with to date.
To start with, try out the below pivot table in a couple of different orientations. This helps to show the trend in deal creation compared to the months in which impressions for those companies were registered. Using this we can start to see trends in engagement prior to deal creation as well as post.

- By Company Name
- Chart type: Pivot table
- Sources: Companies (primary), Deals, Signals
- Filters: Signal Type is any of LinkedIn Ad Impression, pipeline is new business and deal create date is this quarter (can always change this in the future)
- Rows: Deal Create Date - Monthly and Company Name
- Columns: Signal Date - Monthly (rename for clarity)
- Values: Sum of your signal property for L7D LinkedIn ad impressions
- By Company/Deal Count
- Chart type: Pivot table
- Sources: Companies (primary), Deals, Signals
- Filters: Signal Type is any of LinkedIn Ad Impression, pipeline is new business and deal create date is this quarter (can always change this in the future)
- Rows: Deal Create Date - Monthly
- Columns: Signal Date - Monthly (rename for clarity)
- Values: Deal count and sum of your signal property for L7D LinkedIn ad impressions
Once you have a working test here, try out the same logic using all of your different signal types to see how different signals (and combinations) might be contributing to deal influence.
Next up, let’s get a measure of the level of continual impressions registered among your companies week on week. The below examples display companies with a LinkedIn impression signal each week, with the first showing company count and average number of impressions per company and the second showing the same, but only for companies with more than 25 impressions in that week.
Where this gets far more interesting is in applying list-based filters to analyze impressions and engagement among specific segments. If you’re running ads to target segments, this is a key report to get set up.
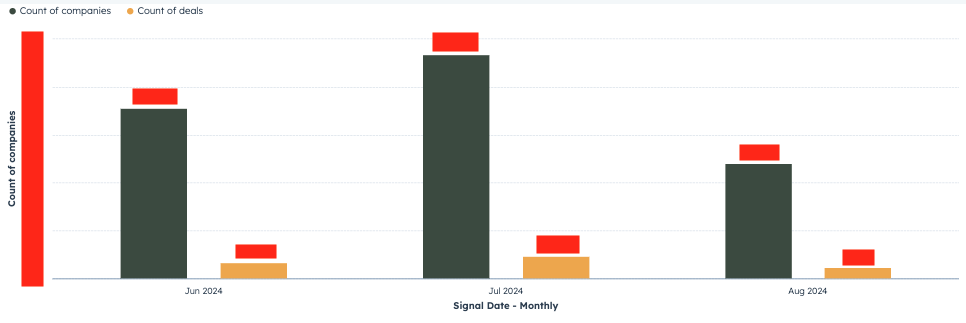
For a more basic report, the below example is proving useful to track our LinkedIn reach at large on a monthly basis. This shows companies and associated deals with a certain threshold of LinkedIn impressions by month. Just as above, an impressions average could be applied here also. The logic for creation is the same as above, but including the deals object as a secondary source.
The real goal here is to pinpoint what it takes to get to the ideal level of regular impressions and engagement in an account / segment to meaningfully influence pipeline over the longer term.
Final notes
Getting your TAM into the CRM
Remember, Fibbler is only going to sync to companies that already exist in your CRM, so make sure at the very least your targeted audiences on LinkedIn are well captured in your CRM.
I would thoroughly recommend mapping out, creating and enriching your entire TAM in your CRM. This is a worthwhile exercise so you can start analyzing engagement across your target segments from a variety of angles.
We like to use theTAM/SAM/SOM model here, layering in lots of our historic sales and marketing data to create a model for tagging accounts as tier 1, 2, or 3 in relation to their suitability as a prospect/customer. Using tools like Clay, you can keep your CRM properly enriched on any schedule you choose.
Hubspot’s custom object limits
Note that in HubSpot there are limitations to Custom Object sizes.View the HubSpot product catalog to view most up to date information on technical limits. With upgrades to your package you can have a maximum capacity (as of 2024), of 50 million custom object records.
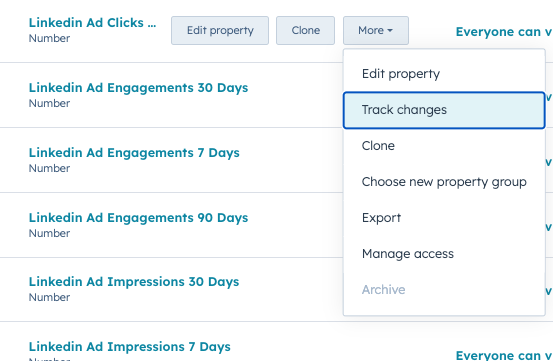
Tracking property changes in HubSpot
If you’re a HubSpot user, you may have noticed an awesome new feature that allows you to track changes to up to 30 properties in your instance.
We’re now using this across a range of different fields at deal and company level; from deal amounts, to close dates, renewal value and churn risk statuses, along with a number of our product usage metrics.
While it could be valuable to set this up for Fibbler updates, the reporting flexibility and ability to host these ‘signals’ among your other types of touchpoint using the custom object pathway should give you a more powerful dataset to work with to inform decision making.
Written by

Freddie Hammond
Sr. Director of RevOps @ Pinpoint